Excel Analytics
Maximizing ROAS through Data-Driven Campaign Optimization
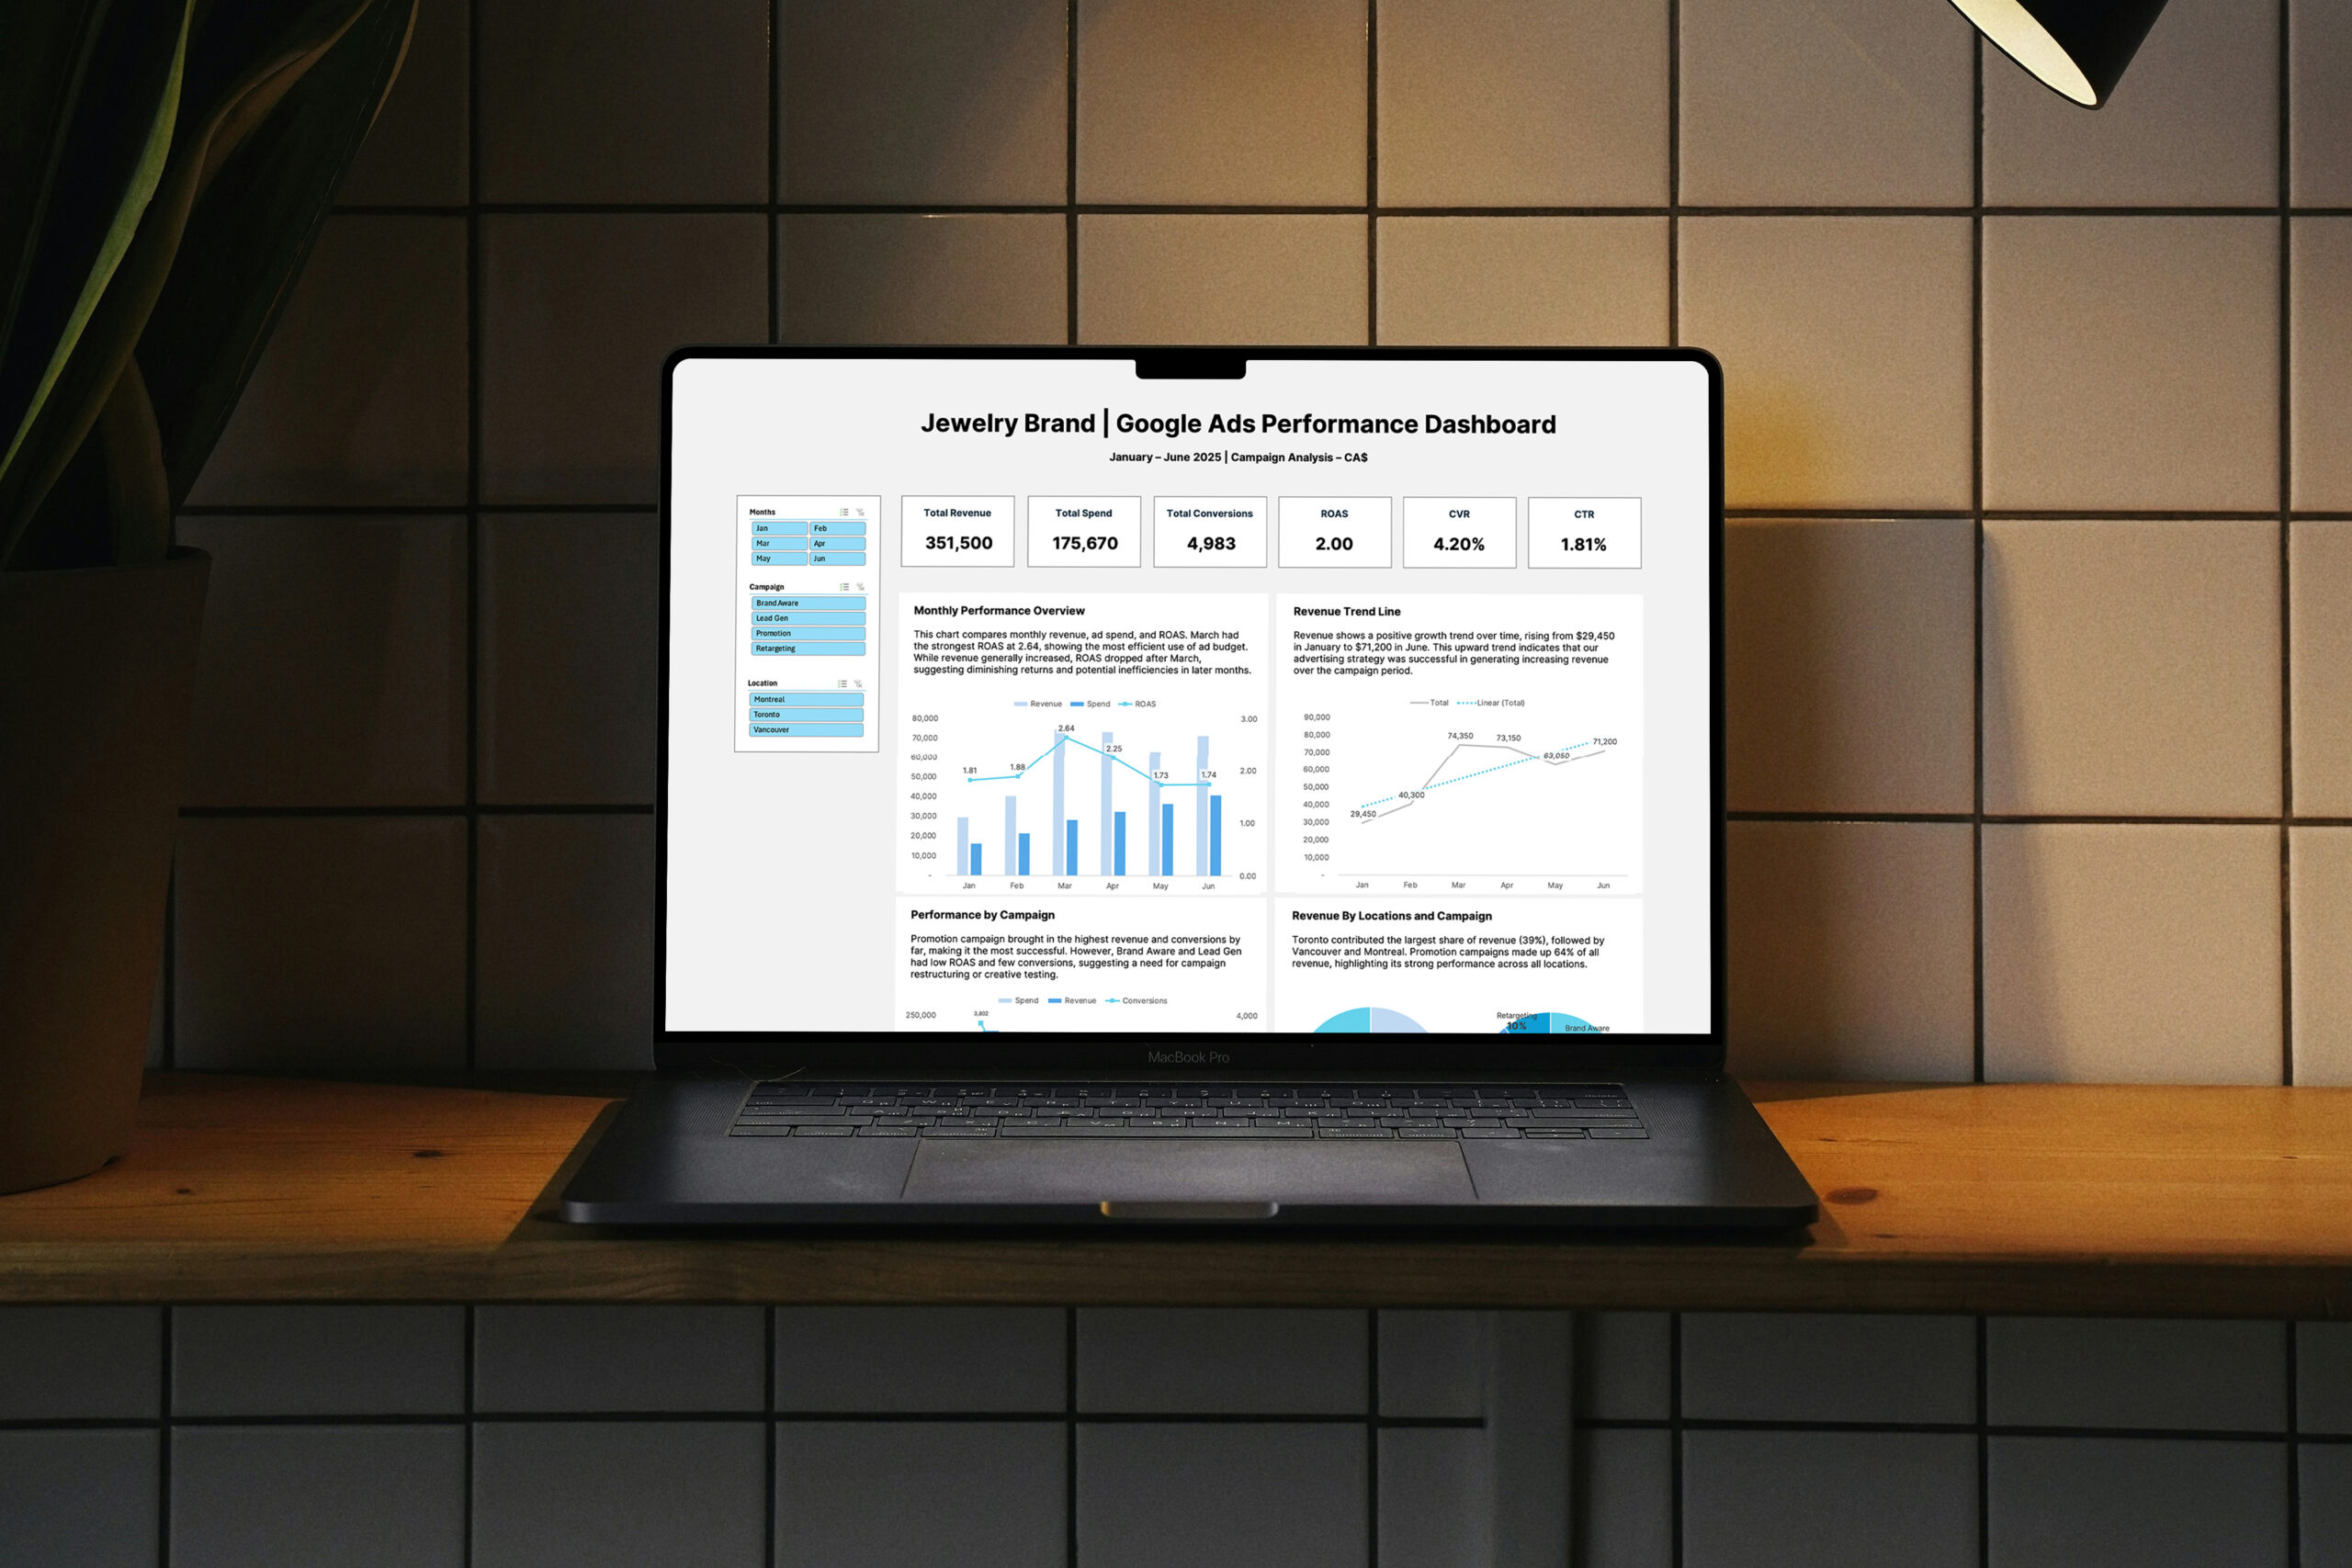
Built an interactive Excel dashboard analyzing six months of Google Ads data for a Canadian e-commerce jewelry brand. The dashboard transforms raw data into actionable insights, enabling campaign optimization and budget efficiency improvements to maximize ROAS.
Role
Performance Data Analyst & Dashboard Developer
Key Skills (Excel)
PivotTables & PivotCharts, Slicers & Timelines, Advanced Formulas (VLOOKUP, INDEX/MATCH), Dynamic Range Visualization.
Evaluate multi-channel campaign performance across four campaigns: Spring Sale, Retargeting, Brand Awareness, Lead Generation
Identify high-performing and underperforming segments
Extract actionable insights to optimize ROAS and budget allocation
02
Data Overview
Source
Google Ads Performance Reports (Raw Data)
Geography
Toronto, Vancouver, Montreal
Metrics Tracked
Impressions, Clicks, Spend, Revenue, Conversions, CTR, CVR, CPC, CPA, ROAS

03
Dashboard Features
Multi-Dimensional Filtering
Slicers for Month, Campaign, and Location for instant segment analysis
Trend Visualization
Revenue vs. Spend correlation to spot diminishing returns
Regional Heatmap
Compare city-level performance at a glance
Performance Highlights
Quick review of CTR, CVR, CPC, CPA, ROAS
100% Excel-Native
Fully functional without external BI tools
03
Data Infrastructure
Source
Google Ads Performance Reports (Raw Data)
Campaign Scope
Spring Sale, Retargeting, Brand Awareness, Lead Generation
Geographic Focus
Toronto, Vancouver, Montreal
Core KPIs Tracked
Impressions, Clicks, Spend, Revenue, Conversions, CTR, CVR, CPC, CPA, and ROAS.
04
Key Insights & Recommendations
Seasonality Matters
ROAS peaked during Spring Sale in March; forecast seasonal peaks and scale budgets by ~20% in Q3/Q4
Prioritize High-Intent Campaigns
Retargeting maintained the highest CVR; reallocate budget accordingly
Address Underperformers
Brand Awareness campaign had low ROAS (<1) and CTR (<2%); revise creative and targeting
Regional Optimization
Montreal lagged in conversions; test localized ad copy for better engagement
Monitor Trend Shifts
CPC rising while ROAS fell in May-June; implement A/B testing for new creatives
06
Attachments
Explore the full functionality and data structure of the project.
(Optimized for Microsoft Excel Desktop)
Explore More Work

Email Marketing: Conversion-Oriented Email Strategy for B2B Growth
Email Marketing: Conversion-Oriented Email Strategy for B2B Growth

Graphic Design That Supports Marketing, Clarity, and Conversion
Graphic Design That Supports Marketing, Clarity, and Conversion
Google Ads Strategy: 708% ROAS through Data-Driven Optimization